 Jędrzej Siewierski
By Jędrzej Siewierski, CEO and co-founder of JSON Crew.
The plan: last year plus 20%. The result: 90%. Same story every year.
It's late October, and in a lot of companies the 2027 plan is being written right now. January is slow, so we pour money into ads. July is swamped, so we hire. In December people have nothing to do, so we freeze hiring. Then October comes around, we sit down to plan again, and we're surprised it came out at 90%.
Before you plan 2027, step into the shower for a minute. It's the shortest lesson on feedback loops I know.
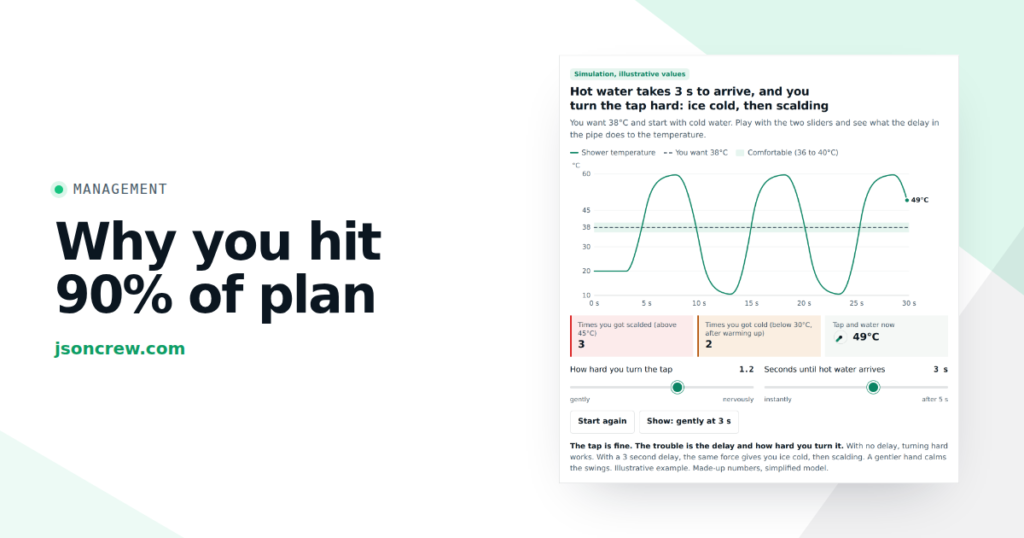
An old shower, the kind at your grandparents’ house. You turn the handle toward hot and nothing happens. You turn it more. Still cold. You turn it again. A few seconds later scalding water hits you, you jump back, crank it toward cold, and a moment later you're standing under ice water. The handle works fine. So does the water. The problem is the delay, and how hard you react to it.
Your company works the same way. The delay is just measured in months, and instead of a handle you have people, budget and customers.
Hot water takes 3 seconds to arrive, and you turn the tap hard: ice cold, then scalding
You want 38°C and start with cold water. Play with the two sliders and see what the delay in the pipe does to the temperature.
- Shower temperature
- Previous try
- You want 38°C
- Comfortable (36 to 40°C)
In short:
- A company is a loop that never switches off: goal, result, gap, decision, action, and then a new result. Engineers have been designing loops like this for 80 years, and they have names for problems you know from your own business.
- „"Always 90% of plan" often happens because the company reacts only to today's gap and forgets how long it has been falling short.
- Three things matter more than your management style: whether you measure the right thing, how long you wait for a decision to show its effect, and where the bottleneck is. Pouring more work into a clogged spot won't help with any style.
- A calm, well-set reaction usually beats an elaborate, nervous one. That's the rule we follow when we build our own tools.
- Build the 2027 plan from the capacity of your bottleneck, phase it in gradually and break it down into department goals and bonuses. Otherwise it stays on a slide.
Your company is a feedback loop that never switches off
Back in the shower. You want 100°F. You check the water with your hand. Too cold, so you turn the handle toward hot. Too hot, so you turn it back. Over and over, for as long as you stand there.
Engineers call this a closed-loop control system with feedback. In plain words: what I want, what I have, the gap, a correction, check again. Every company has a loop like this; usually nobody has drawn it. Feedback loops in business come down to three settings: what you measure, how quickly you see the effect, and how hard you react.
| In The | Your Company Name |
|---|---|
| you want | The goal, the annual plan |
| The temperature you feel on your hand | The result from reports, the CRM and conversations with customers |
| The gap: you want 100, you feel 86 | Goal minus result |
| Your hand on the handle: how far to turn it | The way your leadership team makes decisions |
| Someone runs the kitchen faucet | Competitors, the season, the economy |
Every company has this loop. Usually nobody has drawn it
Tap a part of the loop. You will see what an engineer calls it, what it is in the shower and what it is in Sydney's company (illustrative example).
- In control engineering
- In The
- At Sydney's company
The most popular way of reacting in industrial control is called PID. The three letters stand for three questions the controller (here, your hand on the handle) keeps asking itself:
- P: how far am I from the goal right now?
- I: how long has it been short, and how much has it piled up?
- D: how fast is it changing?
The full names are the proportional, integral and derivative terms. You won't need them again.
According to a 2002 paper by two Honeywell engineers, Desborough and Miller, citing a survey of more than 11,000 controllers in refineries, chemical plants and paper mills, about 97% of them are PID.
Meet Sydney (illustrative example)
We'll follow one company through the whole article. This is an illustrative example: the person, the company and all the numbers are made up, but they resemble real service businesses.
Sydney is the CEO of an HVAC company that installs and services air conditioning and heat pumps. Her plan for 2026: grow from 620 to 1,000 maintenance agreements (steady monthly revenue) and reach $14M in revenue.
| Where things stand in January 2026 (illustrative example) | |
|---|---|
| Team | 46 people, including 28 licensed service technicians |
| Revenue | 4m |
| Service capacity | about 40,600 technician hours a year |
| Margin per technician hour | about $180 on a maintenance agreement, about $60 on a one-off job from a promotion |
| Visit queue | 4 working days |
| Ads | $25k a month, about 410 inquiries |
Remember these two numbers: $180 and $60.
Feedback loops in business: five styles, five controllers
I’ll show each style in the same shower first, then at Sydney’s company.
The on/off switch: all or nothing
In the shower: the handle has only two positions, ice cold or scalding. The water is never just right; it jumps from one extreme to the other. That's how the simplest thermostat works: full power or nothing.
In a company: we freeze hiring, or we hire like crazy. We cut the entire budget, or we double it. You'll spot the symptom right away: the company swings, and every quarter looks different from the last.
P: you react to what you feel right now
In the shower: the colder the water is right now, the harder you turn the handle. Makes sense. But in winter the water coming into the house is extra cold, so the handle has to sit further toward hot than usual. When it's „almost warm”, the gap is small, so you turn too gently and get stuck at 95°F. For good. And if you start turning harder, you're back to ice, then scalding.
Engineers call this the proportional term (P): the bigger the gap right now, the stronger the reaction.
At Sydney's company, from April to June, she hits 88 to 91% of plan every month. The leadership team says „bad luck, the season started late”. It may not be bad luck. The extra-cold water here is a constant drag: every month some customers don't renew, so she has to keep selling new agreements just to grow. A leadership team that only looks at today's gap sees 90% as „almost there” and pushes too gently. The shortfall comes from the rule itself, not from a bad streak. Push harder, and the company starts to swing.
I: you remember how long it’s been too cold
In the shower: you’re standing at 95°F, thinking „it’s been too cold for a good minute now.” Every few seconds you turn the handle a bit further, until you reach 100°F. Your memory of the cold only stops growing once the water is right.
Engineers call this the integral term (I): the reaction grows with the accumulated shortfall, meaning how long and how badly you’ve been short of the goal.
It has two flaws. It's slow. And once the handle is turned all the way and the water is still too cold, your memory of the cold keeps growing anyway. When the hot water finally arrives, your head still says „not enough”, so you don’t turn back in time and you get scalded. That's integral windup. We’ll come back to it in Sydney’s year.
At Sydney's company, the I term is the memory of the gap to plan. For three months she’s been about 10% short, so every month the leadership team adds a little more: another campaign, another promotion, another talk with the sales team. That removes the permanent „almost”. But once the technicians are at 100%, adding more does nothing, and the backlog keeps growing.
D: you watch how fast it's changing
In the shower: you feel the water warming up very fast. It's only 93°F, but it's about to be scalding, so you stop turning before you get burned. You react to the speed of the change, not to how far you still have to go.
Engineers call this the derivative term (D): the reaction depends on how fast the gap is changing.
The flaw: an old shower sometimes flickers on its own, a little warmer, a little cooler, even though nobody touched the handle. If you react to every flicker, you never stop turning. Engineers say D amplifies noise. And D on its own doesn't know where the goal is, so it never works alone.
At Sydney's company, the D term is the early signals: the queue is getting longer, discounts are creeping up, customers take longer to reply. It's good to spot them before the result drops. But weekly numbers flicker too: 380 inquiries one week, 440 the next, for no reason at all. A leadership team that reacts to every weaker week changes course every week.
Combinations: PI, PD, PID
- PI: you turn based on how cold it is now, and turn further when the cold lasts. You end up at 100°F, but you notice a sudden warm-up late. In a company: the mature, steady business. It hits the goal, but sees a change in trend late.
- XP: you react to what you feel now and to how fast it's changing, but you don't remember how long you've been cold. Quick and smooth, but stuck at 95°F. In a company: the nimble young business. Great at catching trends, never quite closes the gap. A new direction every quarter, nothing finished.
- PID: all three at once: now, memory and speed. On paper, the best.
P: the result stalls at about 90% of plan
Sydney's service contracts over 2 years. The goal rises from 620 to 1,000 within a year. Same market, same season, same noise in the reports. Only the way management reacts changes.
- Contracts: P
- For comparison: well tuned PI
- Goal
- Plan ±5%
The catch: in the same paper, on a larger sample of about 26,000 PID controllers, only about one in three performed acceptably. Almost one in three wasn't controlling anything on its own: an operator had switched it to manual, or it sat pinned against its limit, like a handle turned all the way. In practice, the D term is the one used least. Many engineers turn it off, because with a flickering measurement it does more harm than good.
It's the tuning that counts, not the type.
A stronger reaction is not a faster result
Sydney wants to go from 620 to 1,000 contracts. Move the slider toward “nervous” and see what happens to overshoot and to the time it takes to get there.
- Contracts with your setting
- Just-right setting (0.7)
- Goal 1,000
- Plan ±5%
The corporation, the company riding a wave, the company in a discount spiral
Back in the shower one more time. The same hand on the handle can be set up in four ways. Engineers talk about „damping”, meaning how strongly a loop brakes its own momentum.
- Overdamped: you turn so carefully that you never get scalded, but warm water takes five minutes. In a company: the corporation. It never overshoots, but it takes years to reach the goal.
- Underdamped: ice, scalding, ice, scalding, before the water settles. In a company: the young business riding a wave. Hire 20, fire 15, hire 10.
- Just right: you get to 100°F quickly, a moment of slightly too warm at most. This is the target.
- Unstable: every move you make is bigger than the last, until you're swinging the handle from one end to the other. In a company, the loop winds itself up. The classic is the discount spiral: a discount, lower margin, a need to sell more, another discount.
Four temperaments of the same loop
How a company reaches a new goal (dashed line), depending on how its decision loop is set up.
The “add a discount” rule feeds itself: each round costs more
November at Sydney's company. Margin drops below plan, so management adds a discount. The discount lifts sales less than it cuts the margin on every job.
- Monthly margin
- Plan $300k
- Discount
In 1942, Ziegler and Nichols described a method for tuning industrial furnaces: turn up the reaction until the system starts to oscillate consistently, and calculate the (fairly aggressive) settings from that. In a company, that’s pushing the team until it starts to burn out. A furnace will survive it. People, not necessarily.
Sydney's year: what went wrong, month by month
Ads doubled, the queue went from 4 to 19 days
June. The plan is 6% short on agreements. Sydney does what almost anyone would: she doubles the ad budget to $50k and launches a „$99 AC tune-up” promotion. Inquiries go above 800 a month instead of 410.
Except inquiries aren't the bottleneck. The hours of 28 technicians are. It's the handle turned all the way: no more hot water is coming. Engineers call this saturation. In July the technicians are at 100%, and the queue grows until, by the end of September, it has gone from 4 to 19 days.
At full capacity, ads do not grow the result. They grow the queue
Weeks from June to October. Sydney's service team handles about 780 hours a week. Set the ad budget and watch where every dollar goes.
- Weekly margin with your budget
- With a $25k budget
- Visit queue in working days
- 7 day limit
Goodhart’s law: marketing in the green, the company in the red
Marketing is judged on the number of inquiries, so its dashboard is all green. The problem is that 60% of the new inquiries are cheap one-off repairs at $60 of margin per hour, and they eat the hours that customers on a $180 agreement need.
A parent pays a child for every page read, so the child picks books with huge print. More pages, no more reading. The economist Charles Goodhart described this in 1975, and the anthropologist Marilyn Strathern put it most briefly: when a measure becomes a target, it ceases to be a good measure. That’s Goodhart’s law.
Marketing shows green, the company loses
From June to August, Sydney’s marketing is measured by the number of inquiries. Choose what you measure it by from September and see what happens in the company by November.
Marketing dashboard
✓ Green
Inquiries per month
Company dashboard: August → November
✗ Red
Queue, overtime, people quitting: when the memory of the backlog starts to hurt
Remember the handle turned all the way, and the memory of the cold that keeps growing? This is it: integral windup. The memory of the backlog (I) keeps growing, even though the handle can't give any more.
At Sydney's company the gap to plan keeps growing, so the leadership team keeps cranking: ads stay high, Saturdays and overtime begin. A few weeks later, three senior technicians quit. There are fewer people, and the queue keeps growing.
The cure is well known: when technicians are loaded above 90%, the backlog on agreements stops feeding more inquiries and more overtime. The memory of the backlog goes back to work only when there's free capacity.
Dead time: the worst enemy
Step back into that old shower. The time while the hot water is traveling through the pipe and you still feel nothing, engineers call dead time.
The longer the delay, the more gently you turn the handle.
Sydney has several dead times. A new technician works alone only after about 4 months (licensing, then ride-alongs with a senior tech). A customer on an agreement who was poorly served in July leaves only at renewal, 2 to 3 months later. In October, 41 customers leave at renewal, and the number of agreements falls back to 790.
In your company it might be the sales cycle, net-60 payment terms or the time it takes a new sales rep to ramp up. A decision today, an effect next quarter. If you judge a decision after a month, you're judging random swings, not its effect.
Decision today, effect in 4 months: the same reaction turns into a pendulum
Two years of hiring at Sydney's company. The need for technicians grows in summer. Every month, management hires as many people as are missing today. A new hire can only work alone after a few months.
- Technicians working alone
- Need (season, peak in July)
- Hires
- Layoffs
The bullwhip effect in hiring
In August, Sydney hires six junior technicians. Because of the dead time, they only work on their own in December, when there's the least work. Meanwhile the warehouse panic-buys parts, and in November it's overflowing.
That's the bullwhip effect: a game of telephone with orders. Every link in the chain adds a little "just in case", and at the end the factory thinks the world has gone mad.
That's literally what happened at Procter & Gamble: diaper orders from distributors swung far more than what parents were actually buying, as Lee, Padmanabhan and Whang described in their classic article on the bullwhip effect in supply chains. The good news comes from research on the beer game, the MIT simulation that recreates a chain like this: with repeated rounds, people play better. It can be learned.
In a service company, the chain is hiring: you hire at the peak, and people are ready for the trough.
A small move at the customer, a big one at the supplier
Three links: customers, Sydney's company and the parts wholesaler. In week 8, customers want 10% more visits, and it stays that way. Each link orders based on what it sees on its own end, and deliveries arrive with a delay.
Noise, review frequency and the dead band
In the shower, you check the water with your hand. Check once a minute and you'll get scalded in between. Check every half second and you'll turn the handle at every flicker. In a company, how often you review has to match the delay. A quarterly review is too rare when the effect shows up after two weeks. A daily one mostly catches random swings.
Then there's the dead band. You don't touch the handle when the water is 99 or 101 degrees, only when it clearly drifts from 100. In a company, plus or minus 5% from plan is normal swaying, not a reason for a leadership meeting. The same goes for sales forecasting: a forecast that moves 3% in a week hasn't told you anything new yet.
Every day, you mostly see noise
A normal year with no crisis. The reports flicker like water in an old shower: the numbers jump up and down a little even when nothing has changed. In July a real 8% drop arrives for two months. Choose how often management looks at the numbers and how big a deviation it ignores.
- Real result
- Reported result
- Dead band
- Panic decision
- Correct reaction
- Late reaction
Strategy on a slide, bonuses as usual
All year, the strategy slide said "we grow on agreements, not on one-off jobs". Nothing changed in the bonuses. Sales got paid for the number of agreements of any kind, including ones far from the technicians' routes. The dispatcher was paid for visits per day, so they picked quick jobs nearby. Marketing was paid for inquiries.
The captain changes the destination, the helmsman never hears about it, and the ship sails on as before. In control engineering this is called cascade control: the outer loop (strategy) sets goals for the inner loops (departments) and runs several times slower than they do. A strategy that never made it into department goals and bonuses exists only on a slide. Whether you run OKRs or KPIs, the question is the same: does the top goal show up in what each team is actually paid for?
The second problem: coupled loops. Two people in one shower, each with their own handle. Each turns theirs, and both end up freezing or getting scalded. At Sydney's company, each department steered its own metric beautifully, and together they wrecked the result. The cure: a shared goal at the handoff between departments.
Every department green, the company red
Sydney's three departments and their bonuses. Each slider is how hard a department chases its own metric. Then turn on shared goals where the departments hand work to each other.
Captain: the strategy goal never reached the bonuses
- Bonuses for own metric
- Shared goals at handoffs
- Plan $6.0M
- Horizontal axis: how hard departments chase their metrics
Before you change the plan: four questions for your team
Before a doctor prescribes anything, they take your temperature. Engineers also check how the system behaves first, and only then tune the controller. Before you change anything in your 2027 plan, go through four questions with every department.
- Where is the biggest pile of work sitting today, and for how many days? This shows the bottleneck better than any opinion about who can't keep up.
- What number is that based on, and when did you last look at it? If the answer is "well, everybody knows", you don't have a sensor, you have an anecdote.
- How much time passes between a decision and its first effect? That's your dead time. It decides how hard you're allowed to react.
- What did we do last time the result drifted, and how did the company respond? An engineer would call this checking the system's response: you've already turned the handle hard once, so see what the water did before you turn it again.
The second question matters most. It separates measurement from storytelling.
For every number, ask two more things: can I see it (can it be measured in time), and can I influence it? A number you can't see is no good for steering. A number you can't influence is good, at most, for watching.
At Sydney's company, asking for the numbers did the job. The data showed that 41% of technician hours went to one-off jobs at a margin of about $60. It also showed that when the queue goes past 7 days, agreement customers start leaving 2 to 3 months later. A caveat: this relationship is an assumption of our example. In your company, check it against your own data.
Recognize your company in 30 seconds
Symptom in the company, reaction style and what is missing
| Symptom | How your company reacts | What is missing |
|---|---|---|
| Constant swinging: one moment we freeze, the next we hire like crazy | on/off switch | a proportional reaction and a dead band |
| Always 90% of plan | P only | memory of the backlog (I) |
| Problems show up only in the results | PI | early signals (D) |
| New directions every quarter, nothing finished | PD | memory of the backlog (I) |
| Panic every week | too much D | noise filtering |
| Queues, then burnout | I with no safeguard | a work-in-progress limit |
| Every department green, the company loses | good department loops, bad cascade | shared goals at the handoffs |
| Good decisions come too late | long dead time | fast leading indicators |
Where is your company getting stuck?
Eight statements about how your company reacts to its numbers. For each one, pick how often it happens to you. At the end you'll see what kind of controller your company is today, what it's missing and where to start.
None of the eight statements fits your company. Good sign: your decision loop is calm. Check it once a quarter, because the wobble usually starts when you grow or the market shifts.
I'll send you 10 questions to map one process, with tips for your result
✓ Sent
CEO of Ideo Solutions AS
How Sydney fixed it
She didn't switch to a "better" management style. First she fixed the sensors, the delays and the bottleneck, and only then did she set up a calm PI.
- A new sensor instead of the inquiry count. Sydney watches accepted sales opportunities, margin per technician hour and how many days the oldest request without a scheduled visit has been waiting. That last one warns her before the result drops, but only if it really moves with the result.
- A filter in front of the queue. The form asks about the service area, the type of equipment and interest in an agreement. An inquiry from outside the area, or a low-margin one, gets an honest, later slot or a higher price.
- A lifeguard at the water slide. When it gets crowded at the bottom, the lifeguard stops people from going up. At Sydney's company, once the queue reaches 5 days, ads for one-off jobs are gradually turned down, and at 7 days they stop.
- The season, planned ahead. Agreements are pre-sold in March and April, and hiring happens in February, so new people are ready for June, not for December.
- A calm PI with a dead band. Results are reviewed once a month. A deviation within ±5% counts as noise, and outside that band the correction is gentle, even when one weaker week tempts you to react. When technicians are loaded above 90%, the backlog on agreements doesn't feed more inquiries; it raises the price of one-off jobs instead.
- Strategy in the bonuses. The annual goal is broken down cumulatively by quarter. Sales gets a bonus on the margin of agreements within route zones, the dispatcher on deadlines kept for agreement customers, marketing on accepted opportunities, but only as many as the service team can handle.
- Big customers, separate rules. Agreements covering more than 50 units go down a separate path, with a longer cycle and a calmer reaction.
The result (still an illustrative example, deliberately no miracles): after 8 weeks the queue drops to 5 days. In December there are 930 agreements, still fewer than 1,000. Margin per technician hour goes up, and there's no overtime. And most important: Sydney builds the 2027 plan from 930 agreements and from the service team's capacity, not from a wish on a slide.
How to measure marketing when people are the bottleneck: the theory of constraints
In The Goal, the well-known business novel about a factory, Eliyahu Goldratt describes a Boy Scout hike. The troop keeps stretching out, because everyone walks at their own pace. The fix: the slowest boy, Herbie, goes to the front. The whole troop walks at his pace and stays together.
That story grew into the theory of constraints and a simple method called drum-buffer-rope. The drum is the pace of the bottleneck. The buffer is a reserve of work in front of it (measured in time), so it never stands idle. The rope means letting new work in only at the pace the bottleneck can process it.
The slowest link sets the pace for the whole company
At the top, a scout troop with the slowest boy walking in front. Below, the same setup in Sydney's company (illustrative example).
↺ Feedback: the queue is longer than 7 days, so ads for one-off jobs pause on their own.
The conclusion for marketing is uncomfortable: marketing should deliver as many inquiries as the bottleneck can process, plus a safe reserve. In practice:
- Count value per unit of your scarcest resource. For Sydney, that's margin per technician hour. For you it might be an hour of a designer, an engineer, or the one person who does all the quotes.
- Count accepted sales opportunities and the cost per accepted opportunity, not the cost per inquiry.
- Compare lead sources over a window at least as long as your dead time. If it takes 3 months to go from inquiry to contract, a monthly campaign report tells you very little.
- Set a lifeguard rule: when the queue grows past an agreed number of days, you gradually turn down low-value inquiries.
- Don't react to one weak month. That's noise.
So you don't swing to the other extreme: an accepted inquiry has to be handled fast. A study published in Harvard Business Review in 2011, The Short Life of Online Sales Leads, showed that most companies respond to web inquiries too slowly, and the chance of reaching the customer drops with every hour. Fewer, better inquiries, answered right away. If your bottleneck is the person who prepares quotes, that's the hour to protect first; I wrote about it in the article on quote software for manufacturers.
More inquiries can bring in less money
Enter your company's numbers or keep Sydney's. The calculator works out how much an hour of your scarcest resource earns (for Sydney: a technician) and what happens to the queue.
The bottleneck is full. More inquiries make the queue longer.
In our own company: we start with a calm PI, not with PID
A calm hand on the handle will usually beat one that also jerks at every flicker of the water "because it's reacting to the trend". That's how we decided for ourselves, too.
Our internal tool helps us find companies with a buying need. We're designing a controller for it that splits the work between our sales paths. We could have given it a full PID. We gave it a calm PI, with no D term, because we only have a few dozen sales contacts so far, and with that little data most changes are chance.
To be honest: even this PI is waiting until we collect more data, so we don't have a result to show off yet. What we have is a decision we would make the same way in any company with little data.
With a few dozen data points, PID jerks the allocation around
Our tool splits LinkedIn searches between several phrases. We look at one of them, phrase B. Until week 10 it gets a steady 30%, which is right. In week 10 it really weakens, so it should calmly get more, up to about 42%. The dashed line shows how it should be. The blue line shows what the controller does. The more it jumps, the more needless changes.
- Phrase B's share of searches (set by the controller)
- How it should change
A 2027 plan that doesn't rock the company
One last thing, and it applies to you right now: a step change in the goal. Picture wanting the shower at 110°F instead of 100°F all of a sudden and cranking the handle all the way: first nothing for a long time, then scalding water. Better to turn it up a little at a time. A new goal for 2027 works the same way. Announced as a jump, without being broken down by department, it causes a jolt and then stays on a slide.
There's also a calendar effect. Lee, Padmanabhan and Whang described manufacturers where more than 70% of monthly orders came in during the last week of the month. That happened because everyone planned on the same cycle, and sales reps chased the number at the end of the period. A plan on its own can rock a company.
A goal announced as a jump: a jolt, overtime and a slide back to old habits
Sydney's plan for 2027, starting from 930 contracts. Option A: 1,200 right away in January, set only at management level, bonuses unchanged. Option B: the goal rises quarter by quarter to 1,150, is broken down into department goals and bonuses, and hiring starts before the season.
- Service contracts
- Other option
- Goal
- Service team load
- 100% capacity
A checklist before you approve the plan:
- Plan from the capacity of the bottleneck, not from "this year's result plus 20%". How many hours does your scarcest resource have, and how much value do you get out of each one?
- A cumulative goal, broken down by quarter, not a jump from January.
- Every leadership goal has a counterpart in department goals and in bonuses. If it doesn't, it's a wish.
- A shared goal at every handoff between departments (sales and delivery, marketing and sales).
- Measured dead time for sales, hiring and payments. The longer it is, the gentler the reaction.
- A review rhythm matched to the delay, and a ±5% dead band.
- The season and known disruptions planned ahead: hiring and pre-selling before the peak, not during it.
If you want to see these loops on one page, from the first inquiry to the signed contract and the repeat order, here is our map of the B2B sales process.
Where this comes from, and what's new here
I didn't invent any of this from scratch, and that's a good thing. In 1922, the engineer Nicolas Minorsky described mathematically how a helmsman steers a ship: he watches how far the ship has drifted off course, how long it has been drifting and how fast it's turning. A good helmsman allows for inertia: a big ship responds to the rudder with a delay, so he counter-steers before the ship is back on course. That's how the PID controller was born. A quarter of a century later, Norbert Wiener named the field cybernetics (from the Greek word for helmsman) and showed that the same loops work in machines, living organisms and organizations. In the 1960s, Jay Forrester at MIT began modeling entire companies as systems with delays, the start of what we now call systems thinking, and in 1989 John Sterman showed in experiments that managers systematically overreact when the effect of their decisions arrives with a delay.
What I added is small: a translation into the language of a business owner. In conversations with companies I see the same symptoms an engineer would recognize on a chart from a plant: decisions that swing back and forth, a gap to plan that comes back every year, and a clogged bottleneck that keeps getting fed more work. For my own use I call this The Tuned Company, because the point isn't to make more decisions, it's to react in a well-tuned way. To check it in your own business, all you need is the four questions from this article and a sheet of paper.
The most important lesson
When results drift from plan, the first reflex is to add more: double the ad budget, offer discounts, hire in a hurry. When that doesn't work, the second reflex kicks in: cut. Freeze hiring, lay people off, switch campaigns off. Both are reactions to a number in a report, not to its cause.
Before you reach for either, check three things. Whether you measure what the company actually earns on, not just the number of leads. How long it takes for a decision to show its effect. And which team is clogged today. If the bottleneck is your technicians, designers or estimators, more ads only make the queue longer and customers unhappier, and panicked layoffs break the people who stay.
Companies that hit their plan don't react harder. They react calmer, to the right number, and at the pace their team can actually handle.
Frequently asked questions
How are feedback loops in business different from ordinary KPIs and process management?
KPIs and classic process management tell you what to measure and how often. Thinking in feedback loops adds the question of how hard to react when the result drifts, when the effect arrives with a delay and when one spot in the company is clogged. Plenty of companies have good KPIs and still swing from quarter to quarter, because they react too hard or too late.
Is this an alternative to OKRs, EOS (Traction) or Scaling Up?
No. OKRs, EOS and Scaling Up give a company clear goals, a meeting rhythm and a scorecard, and many businesses run well on them. The feedback loop lens works alongside any of them: it helps you decide how strongly to respond to the numbers those systems put in front of you.
Do I need to understand control engineering to use this?
No. The four questions from this article, one good sensor and patience matched to the delays in your company are enough. The engineering terms are only here to give names to things you already know.
How do I find out how long the dead time is in my company?
Measure the time from a decision to its first visible effect: from inquiry to signed contract, from hiring to a new person working alone, from invoice to cash in the bank. Take your last few cases from the CRM and the books, not your gut feeling.
What should I measure instead of the number of inquiries?
Accepted sales opportunities, the cost per accepted opportunity and margin per hour of your scarcest resource. Add one fast leading indicator (for example, the age of the oldest unhandled case), as long as you check in your own data that it really moves with the result.
How often should I review results?
The gap between reviews should be shorter than the time it takes a decision to show its effect, but not so short that you react to random swings. For many service companies a monthly review with a clear dead band (for example ±5%) and a weekly glance at a few fast indicators is a sensible setup.
Will a new software tool fix bad steering?
Not on its own. A good system gives you a better sensor and a faster reaction: a form that qualifies inquiries, a CRM with data you can trust, a quick reply to every request, quoting that takes minutes instead of days (more in what CPQ software is). But diagnosis comes first, the tool second. Otherwise you'll just measure the wrong thing faster and more beautifully.
Three numbers from your company
Want to see where the bottleneck in your sales is?
Send us three numbers from last quarter at contact@jsoncrew.com: how many inquiries you had, how many signed contracts, and how many days a customer waits for delivery. We'll reply with where we see the bottleneck, and if you like, we'll set up a 30-minute call about what's worth measuring before your 2027 plan.
How to cite this article: Jędrzej Siewierski, "Why Your Company Hits 90% of Its Sales Plan Every Year, and How to Set Up 2027 Differently", JSON Crew, jsoncrew.com, 2026.