 Jędrzej Siewierski
Author: Jędrzej Siewierski, CEO and co-founder of JSON Crew.
„How many will we close this quarter?” The salesperson replies: „Don't worry, I have over a million in my pipeline.” The quarter ends at half that amount.
The funnel total is not a forecast. This is a list of opportunities, some of which will never close, and some of which will only close in six months. No one was lying here: in most companies, the forecast is created by everyone guessing, and then someone adding these guesses. I will show you how to turn guessing into measurement: what to count in the funnel, why forecasts are wrong and what to look for before the money comes.
In short:
- A sales forecast is a measurement, not a prediction. It is intended to show whether the plan is within reach, early enough to react.
- Forecasts are wrong for three reasons: long sales cycle (the impact of decisions is visible after months), large single orders (one month is misleading) and poor measurement (number of inquiries instead of opportunity value).
- You calculate the forecast from the funnel as follows: the value of each opportunity times the probability of winning at its stage, adjusted for the age of the opportunity. The sum of the funnel itself can inflate the result several times (five in the example below).
Driving at night: the forecast is headlights, not a crystal ball
You are driving along a winding road through the forest at night. The headlights illuminate several dozen meters in front of the hood. You don't know what's around the third corner, and you don't need to know. You need to see far enough to brake.
Sales forecasting works the same way. Some future sales are already coming your way: these are opportunities that are in the funnel today. The forecast is the spotlights that illuminate this section. Next comes the darkness, i.e. sales from customers you don't know yet.
How far the spotlight reaches depends on the length of the sales cycle, i.e. the time from the first inquiry to the signed contract. With a long cycle you can see far. But every decision you make today (campaign, new salesperson, promotion) will only take effect after the same amount of time. Move the slider and see what it looks like for you.
What is sales forecasting?
Sales forecasting is estimating how much a company will sell in the coming months, based on opportunities that are already in the funnel (with weighting depending on the stage and age of the opportunity) and metrics that are ahead of the funnel. A forecast is different from a sales plan: a plan tells you how much you want to sell, and a forecast tells you how much you will sell if you don't change anything.
In the article about managing processes in the company I describe each process as a loop: goal, measurement, difference, decision. The sales plan is the goal and the forecast is the measurement. Bad measurement means driving on a road you can't see.
Why does sales forecasting fail so often?
W Gartner study from February 2020 only 45% sales leaders and salespeople declared high confidence in their company's forecasts. In my opinion, three things spoil the forecasts, and none of them are the fault of traders.
Long cycle: a decision made today will work in six months
Return to the night road. The headlights are supposed to give you time to brake. But the braking itself also takes time: from pressing the pedal to stopping, the car travels some distance. If you can see closer than the stopping distance, you will see the obstacle too late.
In a company, the stopping point is the sales cycle. Illustrative example: a manufacturer of steel halls has a cycle of 6 months. In January he sees a weak funnel, in February he increases the advertising budget, in March inquiries come in, and the money from them will arrive only in the fall. If in May the management sees no effect and adds money again, in the fall the company has more orders than it can handle.
A forecast based only on closed trades shows where you were six months ago.
Large orders: one month is misleading
On the road at night, something flashes every now and then: a reflection on the roadside, a shadow, lights from the opposite direction. If you braked at every flash, you wouldn't make it home. An experienced driver only reacts when something stays in the lights for more than a moment.
In many B2B companies, a few large orders a year result in more than a hundred small ones. One big contract in March and March looks like a record. The lack of such a contract in April and April looks like a crisis. And nothing has changed on the market.
See what the report shows with only the monthly results and what the average from three or six months shows (the so-called moving average: in each month you calculate the average of the last few months).
Average is reassuring, but it is late. Choose one that will show real change faster than your sales cycle. For companies with large opportunities, a reasonable place to start is a three-month average plus a short list of large opportunities that you track by name rather than total.
Wrong measurement: you're counting inquiries, not opportunity value
The third thing happens most often. The management sees an increase from 80 to 120 inquiries per month and is pleased with the better forecast. But if there are mainly small inquiries that rarely end in a contract, the forecast only increases on the slide.
Measure what you care about: the value of opportunities that have passed the qualification, i.e. an initial check whether the client has a need, budget and deadline. Therefore, qualifying inquiries is a separate stage on ours sales system map.
Forecasting sales from a funnel in CRM: how to calculate it?
For your funnel forecast, you need three pieces of information about each open opportunity.
- Stage. Where is the opportunity: inquiry qualified, conversation, offer sent, negotiations.
- Probability of winning at this stage. From history, not from a trader's intuition: what percentage of the opportunities that got to this stage did you end up winning. Calculate it from the last 12 months in CRM.
- The age of opportunity. How long does the opportunity lie in the funnel? An offer that waits twice as long as your typical cycle usually closes much less frequently than a fresh one, although formally it is still at the „offer sent” stage.
Each chance counts as: value × stage probability × age correction. The forecast is the sum of these numbers.
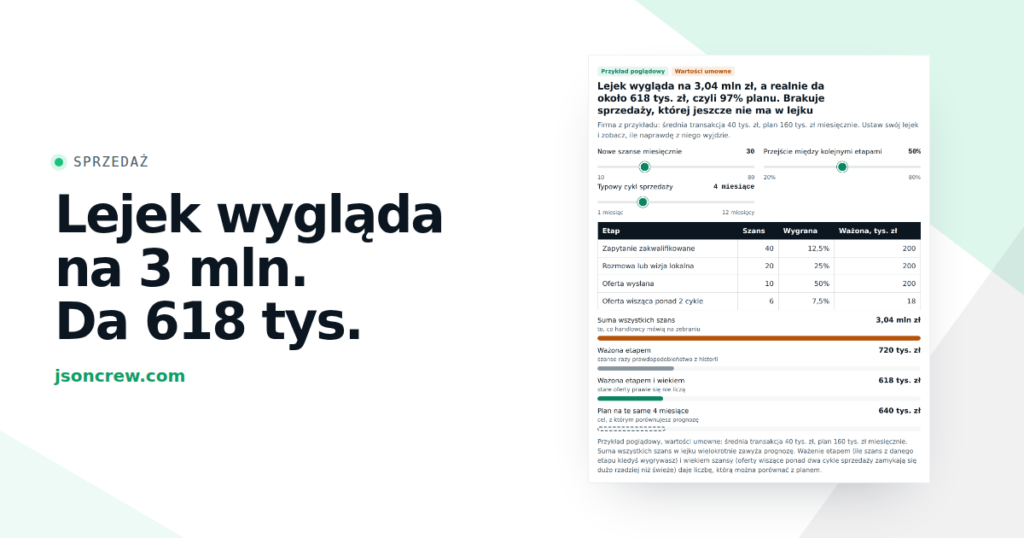
Illustrative example: a company has an average transaction of PLN 40,000. PLN, sales plan PLN 160,000. PLN per month, 4-month cycle and approximately 30 new opportunities every month. At each stage, half the chances go on.
| Stage (illustrative example) | Chances | Chance of winning | Weighted value |
|---|---|---|---|
| Inquiry qualified | 40 | 12,5% | 200 thousand zloty |
| Interview or site visit | 20 | 25% | 200 thousand zloty |
| Offer sent | 10 | 50% | 200 thousand zloty |
| Offer waiting for over 2 cycles | 6 | 7.5% (after age correction) | 18 thousand zloty |
| Total | 76 | 618 thousand zloty |
At the meeting you will hear: „we have 76 opportunities in the funnel of 40,000 each, which is over 3 million.” The stage- and age-weighted forecast says: approximately 618,000. PLN within four months. The plan for this time is 640 thousand. zloty. So the plan is at the limit and we need to act now, not in the last week of the quarter.
The age correction (the old offer retains 15% of the original chance) is an illustrative assumption. Take your number from history.
Move the sliders and see how far the funnel total deviates from what will actually come out of it.
The transition between stages has a stronger effect than the number of new opportunities: improving from 50 to 60% at each stage increases the forecast more than a few additional queries.
Leading indicators: What you see before an opportunity enters the funnel
The headlights have a limited range. But there are also signs on the road: „dangerous turn in 300 meters”. Thanks to them, you know about the turn before you illuminate it.
In sales, such a sign is a leading indicator: a number that changes earlier than sales and actually goes hand in hand with it. For example:
- First interviews arranged during the week. They are visible before an opportunity is created in the funnel.
- First response time to a query. If it increases, in a few weeks fewer inquiries will turn into conversations.
- Age of oldest chance without contact. As it grows, the funnel breaks down from the inside before the score drops.
Such an indicator is only worth something when you check through history that its increase actually preceded the increase in sales. You can turn it on in the first simulation: with a short cycle it adds about a month of visibility.
Sales plan vs. forecast: two numbers that need to meet
Realizacja planu sprzedaży zaczyna się wtedy, gdy co miesiąc porównujesz plan z prognozą, na tyle wcześnie, żeby zdążyć zareagować. Set sales goals for salespeople so that they also improve the forecast: transition between stages, speed of first response, order in old offers. Not just „bring 160k.”.
Simple sales plan, template to copy (illustrative values):
| Month | Plan | Weighted forecast | Difference | Leading indicator | Decision |
|---|---|---|---|---|---|
| November | 160 thousand zloty | 150 thousand zloty | −6% | scheduled calls: 22 (usually 25) | unchanged, the difference is within ±10% |
| December | 160 thousand zloty | 130 thousand zloty | −19% | scheduled interviews: 17 | review of old offers, telephone call to the five largest clients |
| January | 170 thousand zloty | 175 thousand zloty | +3% | scheduled interviews: 28 | unchanged |
The most important column is „Decision”. A table without decisions is a report, not a plan. The range of ±10% means that you do not touch small deviations, because they are a coincidence.
Three numbers to count before the next meeting
The question „how to increase sales” is usually answered with an idea for a campaign. Start with measurement, because only it will show whether the campaign is working.
- Length of the sales cycle. Take the last 20 won transactions with CRM and count the days from inquiry to signature. That's how far your headlights go and that's how long it takes for today's decision to work.
- Probability of winning for each stage. From history, not intuition. If your CRM doesn't save your stage history, start saving it today.
- The value of old chances. Count how many funnel values are opportunities older than two cycles. Move them to a separate column or close them as lost. The forecast will immediately be smaller, but more true.
When it doesn't work
- Not enough chances. With a few trades in a quarter, the historical probabilities are random. Then track each big opportunity by name and agree with the salesperson on the next step with a specific date.
- New product or new market. Without history you have no probabilities. Forecast carefully in the first few months and collect data from day one.
- One order greater than half a year of sales. Don't put it in the average. Calculate the forecast in two variants: with and without this order.
Tool: CRM that calculates the forecast for you
Everything above can be done in a spreadsheet. But the numbers that someone has to manually transcribe quickly become untrue. Therefore, the forecast should be calculated by the system in which salespeople work anyway. If you're just sorting through this topic, start with the text what is CRM and why the system itself is not enough.
In our CRM JSON Hub the same logic works. At each stage, the funnel shows the sum and value weighted by the chance of winning. A card that has been inactive for 14 days gets a red marker, so the age of the opportunity is immediately visible. The forecast shows open opportunities by closing month, total and weighted value, comparison to the previous period, and opportunities after the deadline. Additionally, sales goals and a preview of the pace of goal achievement.
On our map B2B sales process it's a stage closure: this is where opportunities turn into contracts, and the forecast tells whether they will make it on time. If your process is unusual, we build it too web applications for a specific sales process.
Frequently Asked Questions
What is the difference between a sales forecast and a sales plan?
A sales plan is a goal: how much you want to sell. A sales forecast is a measurement: how much you will sell if you don't change anything. Sales forecasting only makes sense if you compare these two numbers every month and make a decision before the difference grows.
How to calculate win probability for a funnel stage?
Take all the odds from the last 12 months that made it to a given stage and count what percentage of them you won. This is the probability for this stage. Recalculate them every quarter.
How far ahead can sales be forecasted?
From the funnel itself, approximately the length of your sales cycle. With a 4-month cycle, the funnel shows the next 2-3 months well, and then less and less. The longer horizon requires leading indicators and assumptions about new opportunities.
What to do when sales jump from month to month?
Look at a 3-month average instead of a single month, set a no-reaction range (for example ±10%), and track large orders separately by name. Then you don't make decisions based on chance.
Will CRM make the forecast itself?
It will count if the data is honest: each opportunity has a stage, a value, a date and a next step. The system will not correct a bad measurement. First figure out what you're measuring, then let him do the math.
Where is your company blocking out?
Eight sentences about how your company responds to results. Next to each of them, indicate how often you do this. At the end, you will see what kind of regulator your company is today, what it lacks and where to start.
None of the eight sentences fit your business. This is a good sign: your decision loop is calm. Check it quarterly, because rocking usually begins when the company is growing or the market is changing.
I will send you 10 questions to list one process, with hints for your result
Sent
CEO of Ideo Solutions AS
One question
Want to know how far your headlights can see?
How long is your typical sales cycle? Reply with one number to contact@jsoncrew.com, and we will tell you how far your headlights can see.
How to Cite This Article: Jędrzej Siewierski, „Sales forecasting: how to stop guessing and calculate the forecast from the funnel”, JSON Crew, jsoncrew.com, 2026.